Monitoring
End-to-end observability from TTFT to full workflow latency. Real-time FinOps dashboards with per-tenant cost attribution, budget enforcement, and an emergency halt switch. Know exactly what your agent fleet is doing — and what it's costing — at every moment.
Monitoring Features
Observability, cost tracking, and real-time fleet visibility.
Dashboard
Real-time command center — monitor agent health, active runs, spend, errors, anomaly alerts, and live agent status cards in one view.
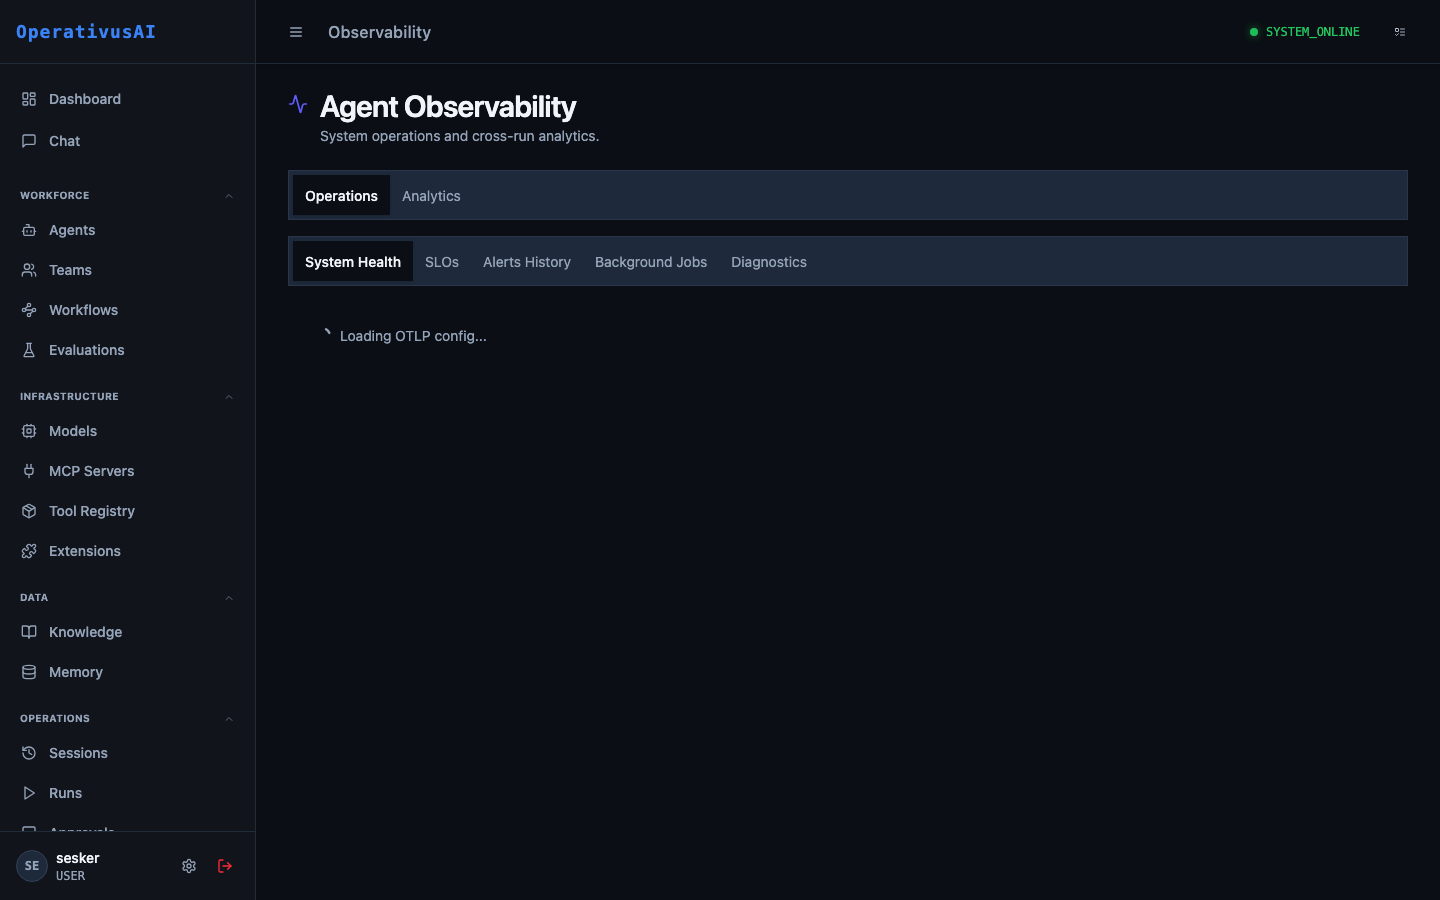
Observability
OpenTelemetry traces, batch evaluation matrices, TTFT-to-completion latency breakdowns, and OTEL export to your existing toolchain.
FinOps & Gateway
Per-tenant token spend tracking, burn rate dashboards, budget enforcement caps, and full gateway traffic inspection.
Network Mesh
Visualize A2A communication topology, peer node health, message latency, and cross-node federation status across your fleet.
Monitoring Capabilities
- OpenTelemetry (OTEL) export
- Prometheus integration
- TTFT latency breakdowns
- Streaming token counters
- Per-tenant cost attribution
- Real-time burn rate
- Budget enforcement caps
- Emergency halt switch
- Agent health status cards
- Anomaly detection alerts
- Error rate tracking
- Active run counters