Overview
The Dashboard is the first screen you see after logging into Procurator. It is the operational command center for your entire agent deployment — providing at-a-glance insight into agent health, ongoing executions, financial spend, error rates, and scheduled activity.
Unlike individual feature pages that provide deep configuration and history for a single resource, the Dashboard is deliberately broad: it surfaces the most important operational signal from every part of Procurator in a single scrollable view. When something is wrong — an agent erroring, spend spiking, or a burn-rate anomaly detected — the Dashboard is where you will see it first.
The Dashboard is designed to be kept open in a dedicated browser tab by operators and team leads. Metric cards reflect live data from your deployment — no manual refresh is required for most indicators. The Active Agents section includes a Refresh button to re-fetch the latest agent status on demand.
Dashboard Layout
Navigate to Dashboard in the left sidebar (the topmost item) to open the command center. The page is organized into four distinct horizontal zones stacked vertically: Procurator Footprint, Operational Metrics, Alert Banners, and Active Agents.
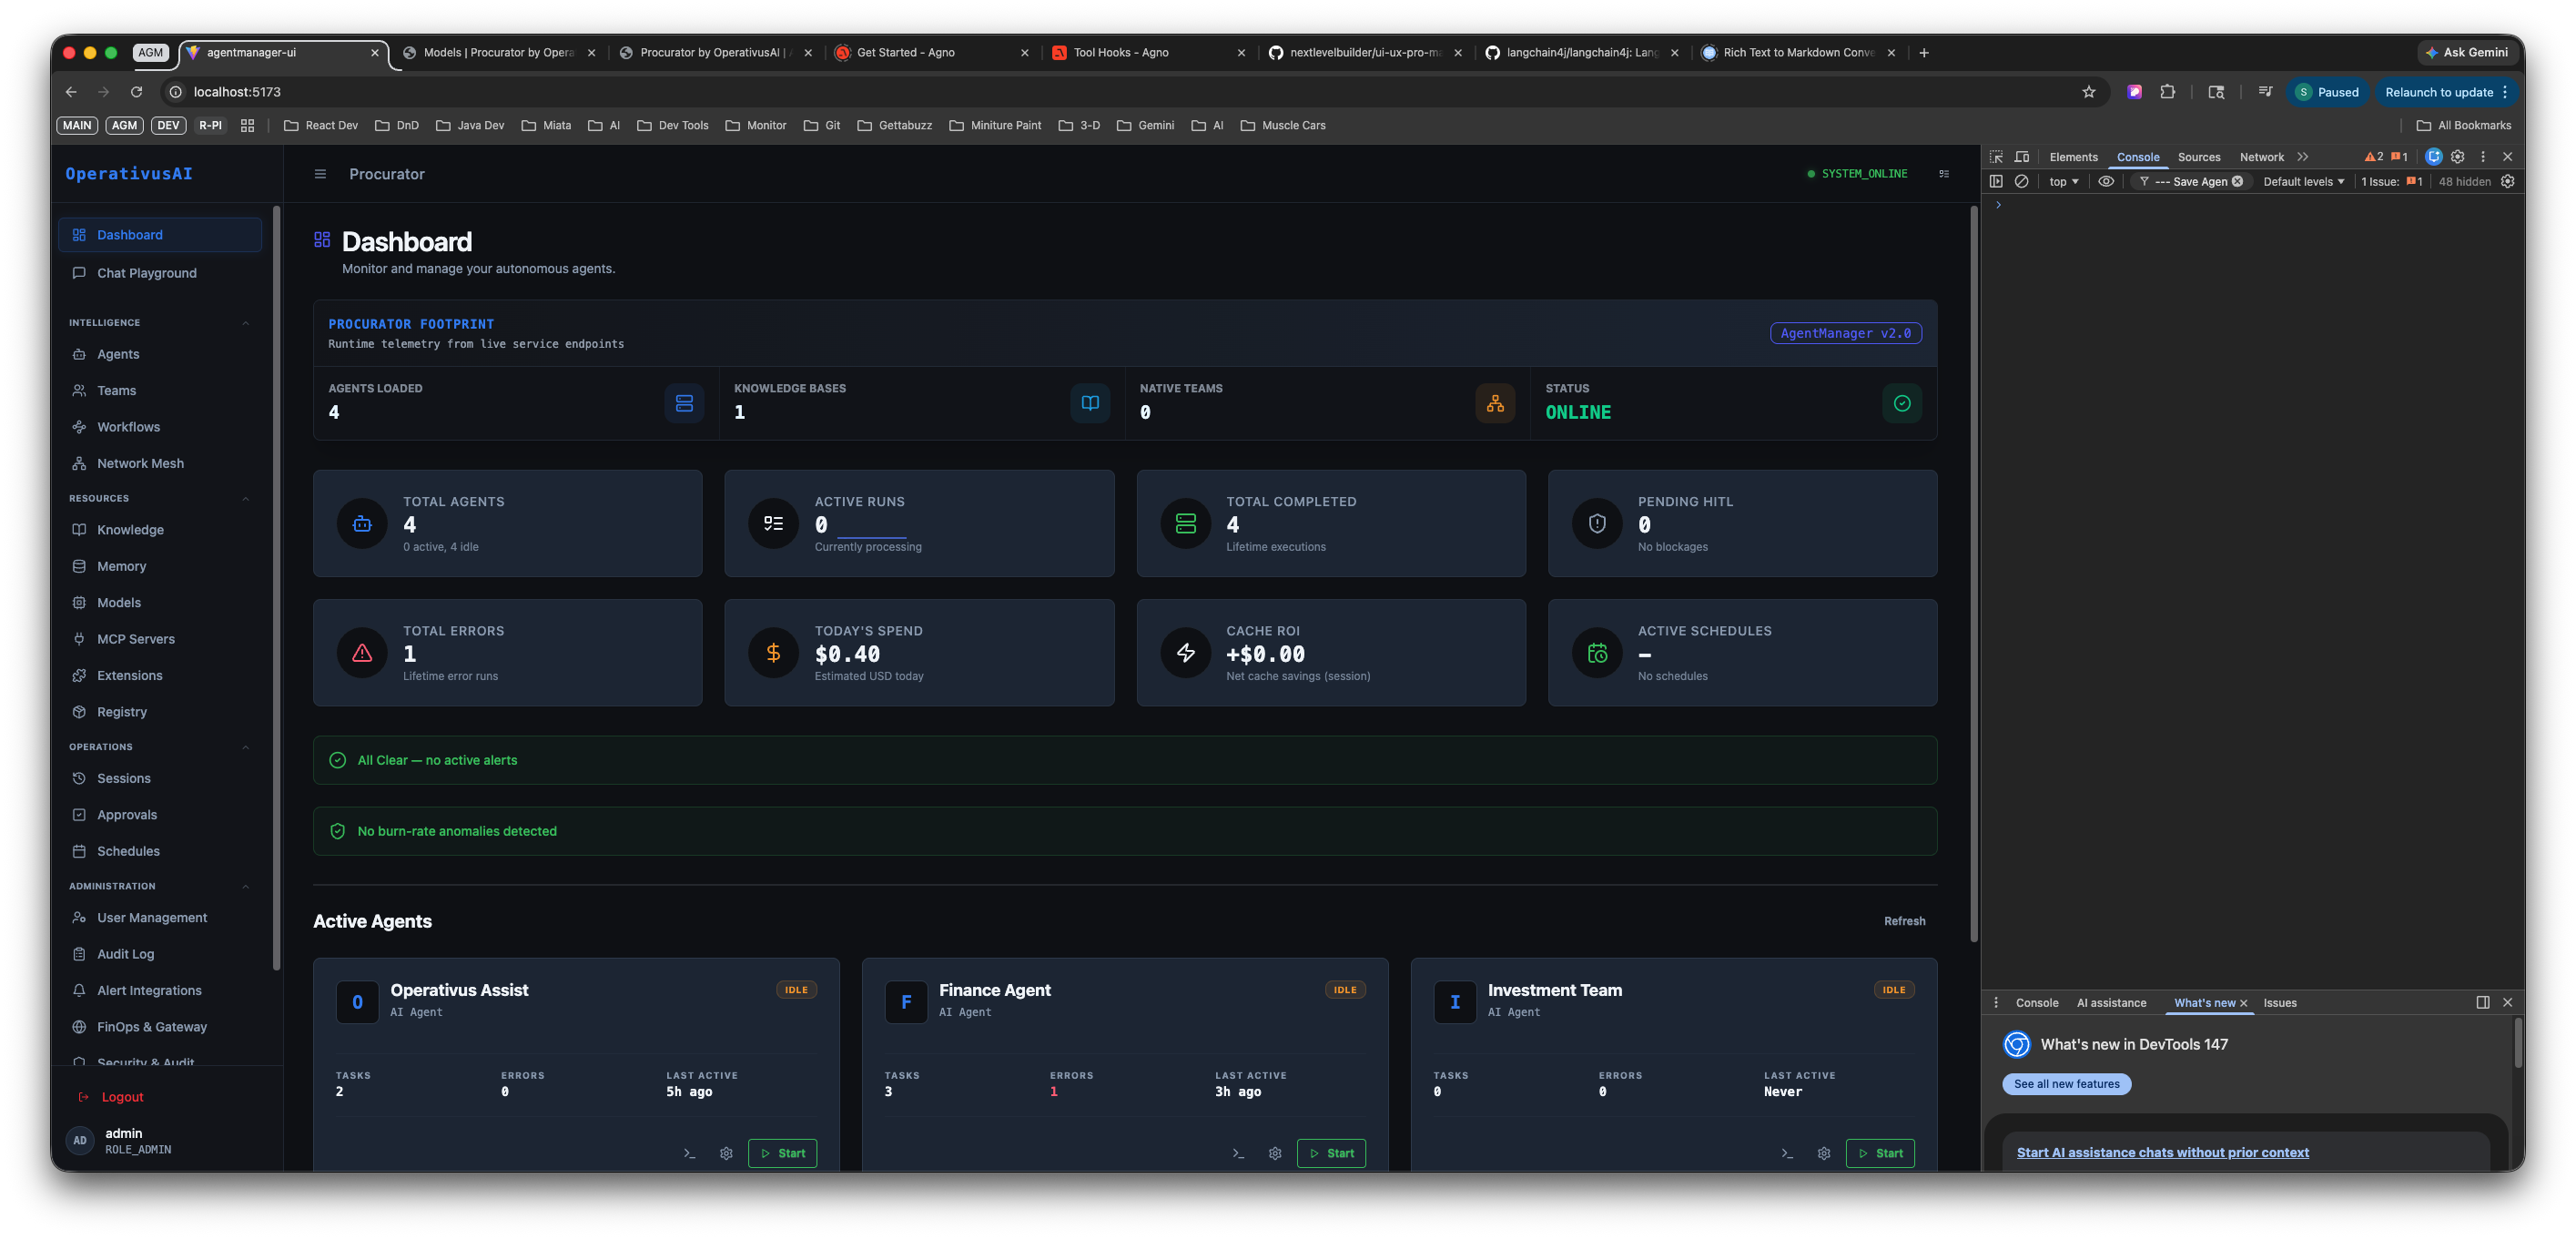
Dashboard — full view showing the Procurator Footprint (Agents Loaded: 4, Knowledge Bases: 1, Active Teams: 0, Status: ONLINE), two rows of operational metric cards (Total Agents, Active Runs, Total Completed, Pending Hits, Total Errors, Today's Spend, Cache ROI, Active Schedules), alert banners confirming no active alerts or burn-rate anomalies, and the Active Agents live status panel.
Sidebar Navigation
The left sidebar provides access to every section of Procurator, organized into five logical groups:
| Group | Items | Purpose |
|---|---|---|
| Top level | Dashboard, Chat Playground | Command center and interactive agent testing environment |
| Workspace | Agents, Teams, Workflows, Network Mesh | Core agent configuration, orchestration, automation, and inter-agent connectivity |
| Resources | Knowledge, Memory, Models, MCP Servers, Extensions, Registry | Data sources, memory stores, model catalog, tool integrations, and extension management |
| Executions | Sessions, Approvals, Schedules | Run history, human-in-the-loop approval queues, and scheduled automation triggers |
| User Management | Audit Log, Hub Integrations, FinOps & Gateway, Permissions & Roles | Security audit trail, external integrations, financial governance, and RBAC configuration |
The Admin section at the bottom of the sidebar is only visible to users with admin-level permissions and exposes organization-wide configuration controls.
Procurator Footprint
The PROCURATOR FOOTPRINT row at the top of the main content area contains four large headline cards that describe the current deployment state at the highest level:
| Card | What It Shows | What to Watch For |
|---|---|---|
| AGENTS LOADED | The number of agents currently loaded and actively serving inference requests. Subtitle: "Running: N live service endpoints." This is the count of agents that are up, healthy, and ready to accept runs. | If this number drops unexpectedly, one or more agents may have crashed or been stopped. Cross-reference with TOTAL ERRORS in the metrics row. |
| KNOWLEDGE BASES | The total number of knowledge base collections currently configured in the organization. Does not indicate whether they are assigned to agents — just that they exist. | A count of 0 means no knowledge bases are available for agents to draw from. If agents are expected to have retrieval capability, this should be ≥ 1. |
| ACTIVE TEAMS | The number of teams currently active and available for orchestrated multi-agent execution. A value of 0 means all agent work is single-agent or unorchestrated. | Expected to be 0 if no team workflows have been triggered. Non-zero indicates an in-progress orchestration run. |
| STATUS | The overall health status of the Procurator deployment. ONLINE (green indicator) means all core services are healthy and operational. | Any status other than ONLINE indicates a service degradation. Check the Observability and Audit Log sections for details. |
Operational Metrics
Below the Footprint section, two rows of four metric cards each provide real-time operational counters. These are the numbers you monitor daily for fleet health:
Row 1 — Execution Metrics
| Metric | Description | Healthy Signal |
|---|---|---|
| TOTAL AGENTS | Total count of configured agents in the organization, including inactive agents. Subtitle shows how many are fully configured vs. draft/incomplete. | Should match AGENTS LOADED unless some agents are intentionally stopped or in draft state. |
| ACTIVE RUNS | The number of agent inference sessions currently in-flight — streaming output or awaiting a response. Subtitle shows the streaming count. | Non-zero during active usage. Sustained non-zero when no users are active may indicate a stuck session — investigate via Sessions. |
| TOTAL COMPLETED | Cumulative count of successfully completed agent runs (sessions that reached a terminal state without error). Subtitle shows the completed run count. | Should trend upward over time as agents are used. A flat line means no runs are completing — even if ACTIVE RUNS is non-zero. |
| PENDING HITS | The number of approval requests currently awaiting human review in the Approvals queue. "No pending hits" means the queue is clear. | Non-zero means agents have paused execution waiting for a human-in-the-loop decision. Navigate to Approvals to review them. |
Row 2 — Financial & Health Metrics
| Metric | Description | Healthy Signal |
|---|---|---|
| TOTAL ERRORS | The cumulative count of agent runs that terminated with an error state. Subtitle shows "No error runs" when zero. | Zero is ideal. A rising error count without a corresponding rise in TOTAL COMPLETED indicates systemic agent failures — check agent configurations and MCP server health. |
| TODAY'S SPEND | The total token spend (in USD) across all agents for the current calendar day. Aggregates input, output, and cache-read token costs across all models. | Monitor against your daily budget. Unexpected spikes may indicate a runaway loop, an extremely long context window, or a misconfigured agent. Navigate to FinOps & Gateway for a full breakdown. |
| CACHE ROI | The net cost savings attributed to prompt caching for the current period. A positive value (e.g., +$0.00 or higher) means caching is saving money by avoiding redundant token processing on repeated prompt prefixes. | Should be positive whenever agents use repeated system prompts, knowledge base retrievals, or tool definitions. A value of $0.00 may indicate prompt caching is not enabled or that your workload has low prompt reuse. |
| ACTIVE SCHEDULES | The number of scheduled agent runs currently configured and active. Subtitle shows "No schedules" when zero. | Non-zero indicates automated triggers are configured. Verify via Schedules that each one is intentional and correctly targeted. |
Alert Banners
Between the metric cards and the Active Agents section, two persistent status banners provide system-level health signals:
| Banner | Healthy State | Alert State |
|---|---|---|
| AI Chat | ✓ AI Chat — no active alerts | One or more chat service issues detected — e.g., model endpoint unreachable, SSE streaming degraded, or Chat Playground connectivity problems. Navigate to the Chat feature to investigate. |
| Burn-Rate Anomaly | ✓ No burn-rate anomalies detected | Today's spend is trending significantly above the expected rate for this time of day — indicating a potential runaway agent, unexpected usage spike, or misconfigured workflow loop. Navigate to FinOps & Gateway for a detailed breakdown. |
Both banners show a green checkmark when healthy. If either banner changes to a warning or error state, treat it as an actionable incident — don't wait for a user complaint. A burn-rate anomaly in particular can compound quickly in a multi-agent deployment.
Active Agents
The Active Agents section at the bottom of the Dashboard renders a live card for every agent currently loaded and available. A Refresh button in the section header re-fetches the latest status data.
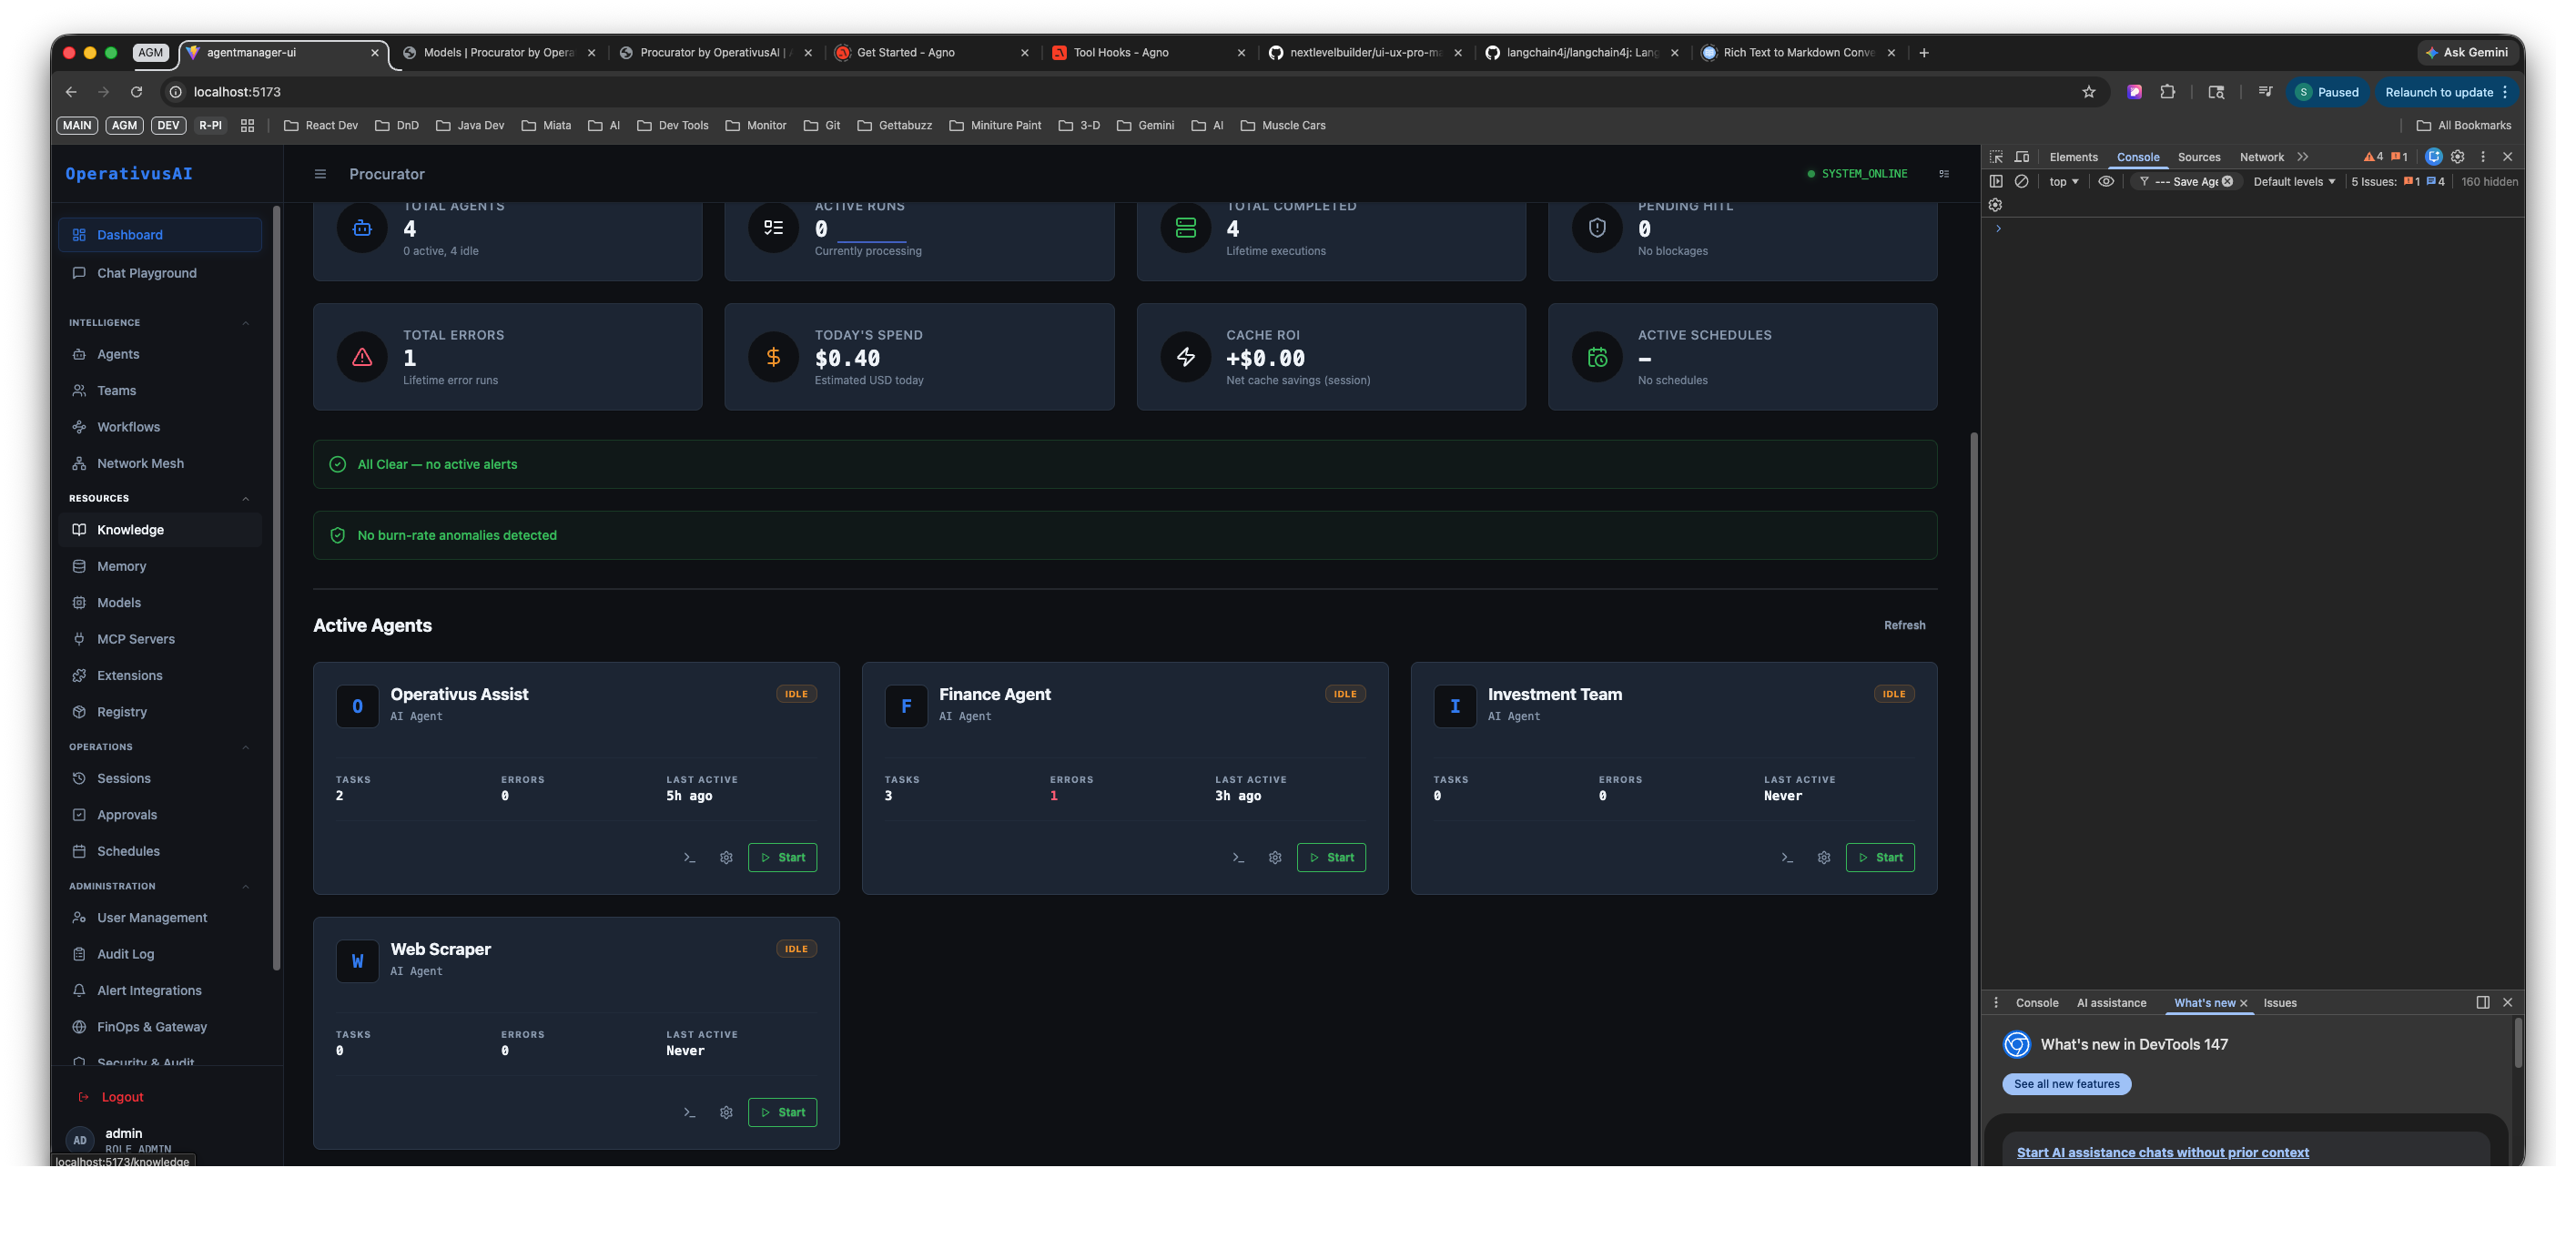
Active Agents panel — all four configured agents shown as live status cards. Each card displays the agent name, type (ML Agent), task counts, error count, last-active timestamp, and a Start button to launch an immediate inference session. Web Scraper shows "Last Active: Never" indicating it has not yet been run.
Each Active Agent card exposes the following at-a-glance fields:
| Field | Description |
|---|---|
| Agent Name | The display name configured in the agent's General tab. Clicking the card name navigates directly to that agent's detail page. |
| Type badge | The agent's classification label (e.g., ML Agent). Set during agent creation; used for filtering and team assignment constraints. |
| TASKS | The number of completed task runs attributed to this agent. A proxy for how heavily the agent has been used. |
| ERRORS | The count of runs that terminated with an error for this specific agent. Non-zero values warrant investigation via the agent's Sessions history. |
| LAST ACTIVE | Timestamp of the most recent interaction with this agent (relative time, e.g., "3s ago"). "Never" means the agent has been configured but never run. |
| Start button | Opens the Chat Playground with this agent pre-selected, allowing you to immediately start an inference session without navigating to the Chat section. |
How to Read the Dashboard
The Dashboard is designed for fast pattern recognition — you should be able to assess fleet health in under 30 seconds. Here is the recommended reading order:
-
1Check STATUS in the Procurator Footprint
The STATUS card (top-right of the Footprint row) is the single most important signal. ONLINE with a green indicator means all core Procurator services are healthy. Any other state means a service-level incident is in progress — investigate before reading any other metric.
-
2Check the Alert Banners
Scan both alert banners below the metric cards. A burn-rate anomaly or AI Chat alert requires immediate attention. If both show green checkmarks, proceed to the metrics.
-
3Review TOTAL ERRORS and TODAY'S SPEND
In the second metric row, check TOTAL ERRORS first — any non-zero value means agent runs are failing and users are experiencing errors. Then check TODAY'S SPEND against your expected daily run rate. A value significantly higher than normal warrants a FinOps drill-down.
-
4Check PENDING HITS
If your workflows use human-in-the-loop approval steps, check PENDING HITS. Non-zero means agents are paused, waiting for a decision. Navigate to Approvals to unblock them — delayed approval decisions stall the entire downstream workflow.
-
5Scan Active Agents for individual anomalies
In the Active Agents section, look for any agent with a non-zero ERRORS count or an unexpectedly old LAST ACTIVE timestamp. A healthy agent with active users should show a recent LAST ACTIVE time. An agent showing "Never" for LAST ACTIVE has been configured but not yet deployed to users.
-
6Cross-reference AGENTS LOADED vs TOTAL AGENTS
In the Footprint, AGENTS LOADED should equal TOTAL AGENTS minus any intentionally stopped agents. A discrepancy (e.g., 3 loaded out of 4 total) means one agent is not running — navigate to the Agents page to identify which one and restart it if needed.
Key Capabilities
Deployment Footprint
Four headline cards give you an instant read on the scope of your current deployment — how many agents are loaded, knowledge bases configured, teams active, and whether the system is online.
Operational Metrics
Eight real-time counters across execution, financial, and health dimensions — Total Agents, Active Runs, Completed, Pending Hits, Errors, Spend, Cache ROI, and Schedules — all in a single scannable view.
Anomaly Alerts
Persistent banner alerts for AI Chat service health and burn-rate anomaly detection. Alerts trigger automatically when spend rate exceeds expected thresholds or chat services degrade.
Live Agent Status
The Active Agents section renders a real-time card for every loaded agent showing task history, error count, and last-active time — with a direct Start button to launch an immediate inference session.
Spend Visibility
Today's Spend and Cache ROI metrics give financial operators immediate visibility into daily token costs and cache savings — without needing to open the full FinOps dashboard for a quick status check.
Unified Navigation
The persistent left sidebar provides organized access to all 16 sections of Procurator — from agent configuration through financial governance — without ever needing to return to a home page.
Permissions
- dashboard:read— View the Dashboard, all metric cards, alert banners, and Active Agents panel
- dashboard:start_agent— Use the Start button on Active Agent cards to launch an inference session from the Dashboard
- finops:read— Required to view Today's Spend and Cache ROI metric cards (financial data access controlled separately)
- approvals:read— Required to view the Pending Hits count; without this permission the card renders as restricted
Metric cards that require specific permissions (such as Today's Spend for non-FinOps roles) render as restricted placeholders rather than being hidden entirely. This ensures operators know that financial data exists but requires elevated access to view — preventing silent information gaps.
Best Practices
- Keep the Dashboard open in a dedicated tab. The Dashboard is designed for ambient monitoring. Operators and team leads should keep it open and visible — treat a burn-rate alert or TOTAL ERRORS spike like a production alert, not something to check during a meeting.
- Investigate AGENTS LOADED discrepancies before user-facing issues emerge. If AGENTS LOADED is lower than TOTAL AGENTS, an agent is down. Users may not yet have reported errors. Proactively checking the Agents page and restarting the stopped agent prevents a support incident.
- Use CACHE ROI to validate caching configuration. If your agents use long system prompts or repeated knowledge base retrievals and CACHE ROI shows $0.00 consistently, prompt caching may not be enabled for your model tier. Verify in the Models configuration page.
- Act on PENDING HITS within your SLA window. Human-in-the-loop approvals block downstream workflow execution. If your team has approval SLAs, monitor PENDING HITS throughout the day and configure alerting to notify approvers when items queue up.
- Use the Active Agents Start button for quick diagnostic runs. When investigating an agent issue, the Start button in the Active Agents panel opens a Chat Playground session without navigating away. This is the fastest path to reproducing a reported user issue.
- Cross-check Today's Spend against FinOps burn rates weekly. The Dashboard's TODAY'S SPEND card gives a daily snapshot. For trend analysis, budget forecasting, and per-agent cost allocation, navigate to FinOps & Gateway for the full historical view with breakdowns by model, agent, and team.
- Treat "LAST ACTIVE: Never" agent cards as deployment checklists. Any agent showing "Never" in the Active Agents panel has been configured but never run. Before go-live, verify each such agent has its configuration complete, its knowledge bases assigned, and its team memberships confirmed.