Overview
Running AI agents in production introduces operational challenges that traditional monitoring tools weren't designed for: model latency variability, token budget saturation, MCP server connectivity, multi-step workflow execution, and cross-agent communication. Procurator's Observability module is built for these patterns.
Observability is distinct from the audit-focused Security module. Where Security focuses on who did what and was it authorized, Observability focuses on how is the system performing and where are the bottlenecks.
Procurator's built-in dashboards give you immediate visibility without configuration. For teams with existing Grafana, Datadog, or Prometheus stacks, all metrics are exportable via standard protocols so you can consolidate AI platform observability alongside your other services.
Control Panel
The screenshot below shows the live Procurator administration interface for this feature.
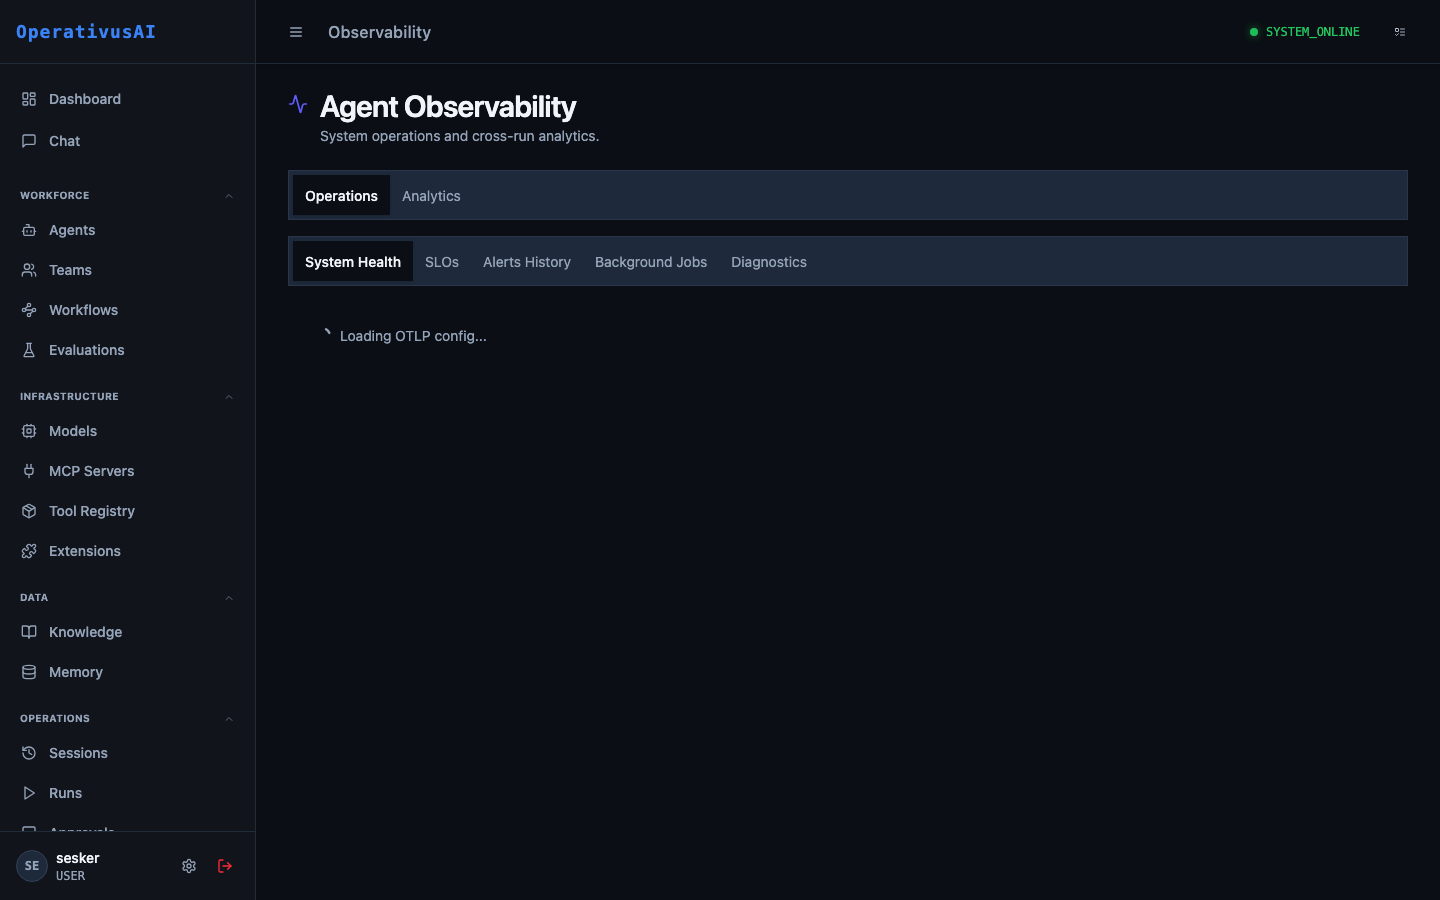
Observability — metrics, traces, and health dashboards for the entire platform.
The Three Pillars
Metrics
Time-series numeric measurements: request rates, latency percentiles, token throughput, error rates, queue depths, budget saturation. Aggregated and stored for trend analysis.
Traces
Distributed traces that follow a single request through the entire Procurator stack — from API ingress through model call through tool invocations to final response delivery.
Logs
Structured platform-level logs from all Procurator services — separate from session message content. Includes framework errors, connection events, and slow query warnings.
Key Capabilities
Real-Time Dashboard
Live operational metrics updated every 15 seconds. See active sessions, model call rates, p50/p95/p99 latency, and error rates without refreshing.
Per-Agent Performance
Drill into any agent to see its request rate, average session duration, token throughput, error rate, and budget saturation trend over time.
MCP Health Monitoring
Real-time connection status for every registered MCP server, with latency histograms and error rate tracking per tool per server.
End-to-End Traces
Trace any session from entry to exit with span-level timing across model calls, tool invocations, knowledge retrievals, and memory operations.
Configurable Alerts
Define alert rules on any metric — fire when error rate exceeds 5%, when p95 latency exceeds 10s, or when active sessions exceed capacity.
Prometheus Export
All metrics available via a Prometheus-compatible scrape endpoint. Point Grafana, Datadog Agent, or any Prometheus-compatible tool at it for custom dashboards.
Administration
Observability Dashboard
Navigate to Administration → Observability. The main dashboard is organized into four sections:
- Platform Overview: Current active sessions, sessions completed in the last hour, model calls per minute, and p95 end-to-end latency.
- Model Gateway: Requests per minute by model, token throughput (input + output), error rate by provider, and budget enforcement counts.
- MCP Servers: Connection status grid for all registered MCP servers, with tool call rate and error rate per server.
- Infrastructure: Procurator service health, database connection pool utilization, Redis cache hit rate, and pgvector query latency.
All charts support configurable time windows: Last 15m, 1h, 6h, 24h, 7d, 30d. Zoom into anomalies by selecting a time range directly on any chart.
Agent Performance Metrics
Select any agent from the agent dropdown to view its performance profile:
| Metric | Description |
|---|---|
| Sessions / hour | Rate of new sessions initiated for this agent. |
| Avg. session duration | Mean time from session start to completion (COMPLETED or FAILED). |
| Avg. turns / session | Average number of conversation turns per session — high values may indicate agent looping. |
| Token throughput | Input and output tokens per minute — input/output ratio indicates how verbose the agent's responses are relative to inputs. |
| Model call latency (p50/p95/p99) | Latency distribution for model API calls. High p99 indicates occasional slow calls that degrade user experience. |
| Tool call rate | Tool invocations per session — agents that call many tools per session may benefit from caching or parallelism. |
| Error rate | Percentage of sessions ending in FAILED status. A sustained non-zero rate requires investigation. |
| Budget saturation | Current spend as a percentage of the agent's configured budget for the current period. |
System Health
The System Health panel shows the operational status of all Procurator infrastructure components:
- API Server: Request rate, error rate, and p99 response latency for the Procurator REST API.
- Agent Execution Runtime: Active execution threads, queue depth for pending sessions, and mean queue wait time.
- PostgreSQL: Connection pool usage, slow query count (>100ms), and storage utilization.
- pgvector: Embedding insert rate, ANN query rate, and mean query latency by index.
- Redis: Cache hit rate, memory utilization, and eviction rate (high eviction suggests cache pressure).
- MCP Server Connections: Status summary — number of servers CONNECTED, RECONNECTING, and DISCONNECTED.
Knowledge base retrieval latency directly impacts agent response time. If pgvector ANN query latency exceeds 200ms, consider reducing the Knowledge Base topK value, adding an HNSW index, or partitioning large knowledge bases.
Distributed Traces
Procurator instruments every session as a distributed trace. To view traces:
- 1Navigate to Observability → Traces
The trace search allows filtering by agent, date range, duration threshold, and status.
- 2Select a trace
Click any trace to open the waterfall view showing all spans for that session.
- 3Read the waterfall
Each span represents a unit of work: API ingress, model call, tool invocation, knowledge retrieval, memory read/write. Spans are shown to scale — long spans are visually prominent.
- 4Click a span
Expand any span to see its timing breakdown, input/output sizes, and any error details.
Alert Rules
Create alert rules under Observability → Alerts:
| Field | Description |
|---|---|
| name | Human-readable name for the alert rule. |
| metric | The metric to monitor (e.g., session.error_rate, model.latency.p95). |
| condition | Threshold condition: >, <, >=, <=, or ==. |
| threshold | Numeric threshold value that triggers the alert. |
| window | Evaluation window in minutes. The metric is averaged over this window before comparing to threshold. |
| scope | Optional: limit to a specific agent, team, or MCP server. |
| notificationChannel | Where to send the alert: email, Slack channel, PagerDuty, or webhook. |
| severity | INFO, WARNING, or CRITICAL — controls notification urgency. |
Monitoring Integrations
| Integration | Method | Configuration |
|---|---|---|
| Prometheus | Scrape endpoint at /metrics | Add Procurator as a scrape target in prometheus.yml. All metrics exposed in OpenMetrics format. |
| Grafana | Via Prometheus datasource | Import the Procurator Grafana dashboard JSON from Settings → Observability → Export Dashboard. |
| Datadog | StatsD UDP or Datadog Agent | Configure the Datadog integration in Settings. Metrics are tagged with agent, team, and model labels. |
| OpenTelemetry | OTLP gRPC / HTTP | Procurator emits traces in OpenTelemetry format to a configured OTLP collector endpoint. |
| PagerDuty | Events API v2 | Configure PagerDuty as an alert notification channel. Alerts create incidents; resolutions auto-resolve them. |
Key Metrics Reference
Permissions
- observability:read— View the observability dashboard, metrics, and traces
- observability:alerts— Create, modify, and delete alert rules
- observability:integrations— Configure monitoring integrations (Prometheus, Datadog, OTel)